Navigating the Portal
Unlock the potentials of the PERIOPSIS Portal
Overview
Welcome to the PERIOPSIS Portal! In this article we will navigate together within the portal and get to know the different features and sections of the portal. The PERIOPSIS Portal is organized into sections including:
- Dashboard: Hosting all the identified mappings in your area of interest.
- Statistics
- Notifications
- My Reports
- User
- Admin
- Settings
Dashboard
Navigating the Dashboard
The dashboard is the heart of the PERIOPSIS Portal, where you can monitor and manage all the detected dumping sites in your area of interest. You have the flexibility to view the detections in two ways: List view and Map view. To switch between List view and Map view click on the switch button on the top right of your screen.
Both the List View and Map View include filtering options to help you find specific detections quickly and easily. You can filter detections by status (Reported, Visited, Cleaned or No Action), or by incident type (Dumping Site, Definite Dump, Likely Dump, Litter, Construction Materials).
By clicking on any of the incidents either on the Map or List view, you will be directed to its dedicated Incident Page, where you can Get Directions to each incident, Report the Incident, Mark as Visited or Mark as Cleaned. To find out more about how to assign a dumping incident to a member of your team, we highly recommend reading our article Assigning Employees to Clean Dumping.
With the List view, all detections related to your search are listed in a clear, organized format. Each detected dumping is represented with a block which previews important information such as the type of waste, date of the detection, distance, latitude and longitude, and status of the dumping (Reported, Visited, Cleaned).
The Map View provides a visual representation of your detections, plotted on a map. Each detection is represented by a marker on the map, providing information about the type of waste. Clicking on a marker will display more information about that particular detection, including the type of waste detected, date of the detection, distance from your offices, actual geographical location, and status of the dumping (Reported, Visited, Cleaned), as well as a button for directions.
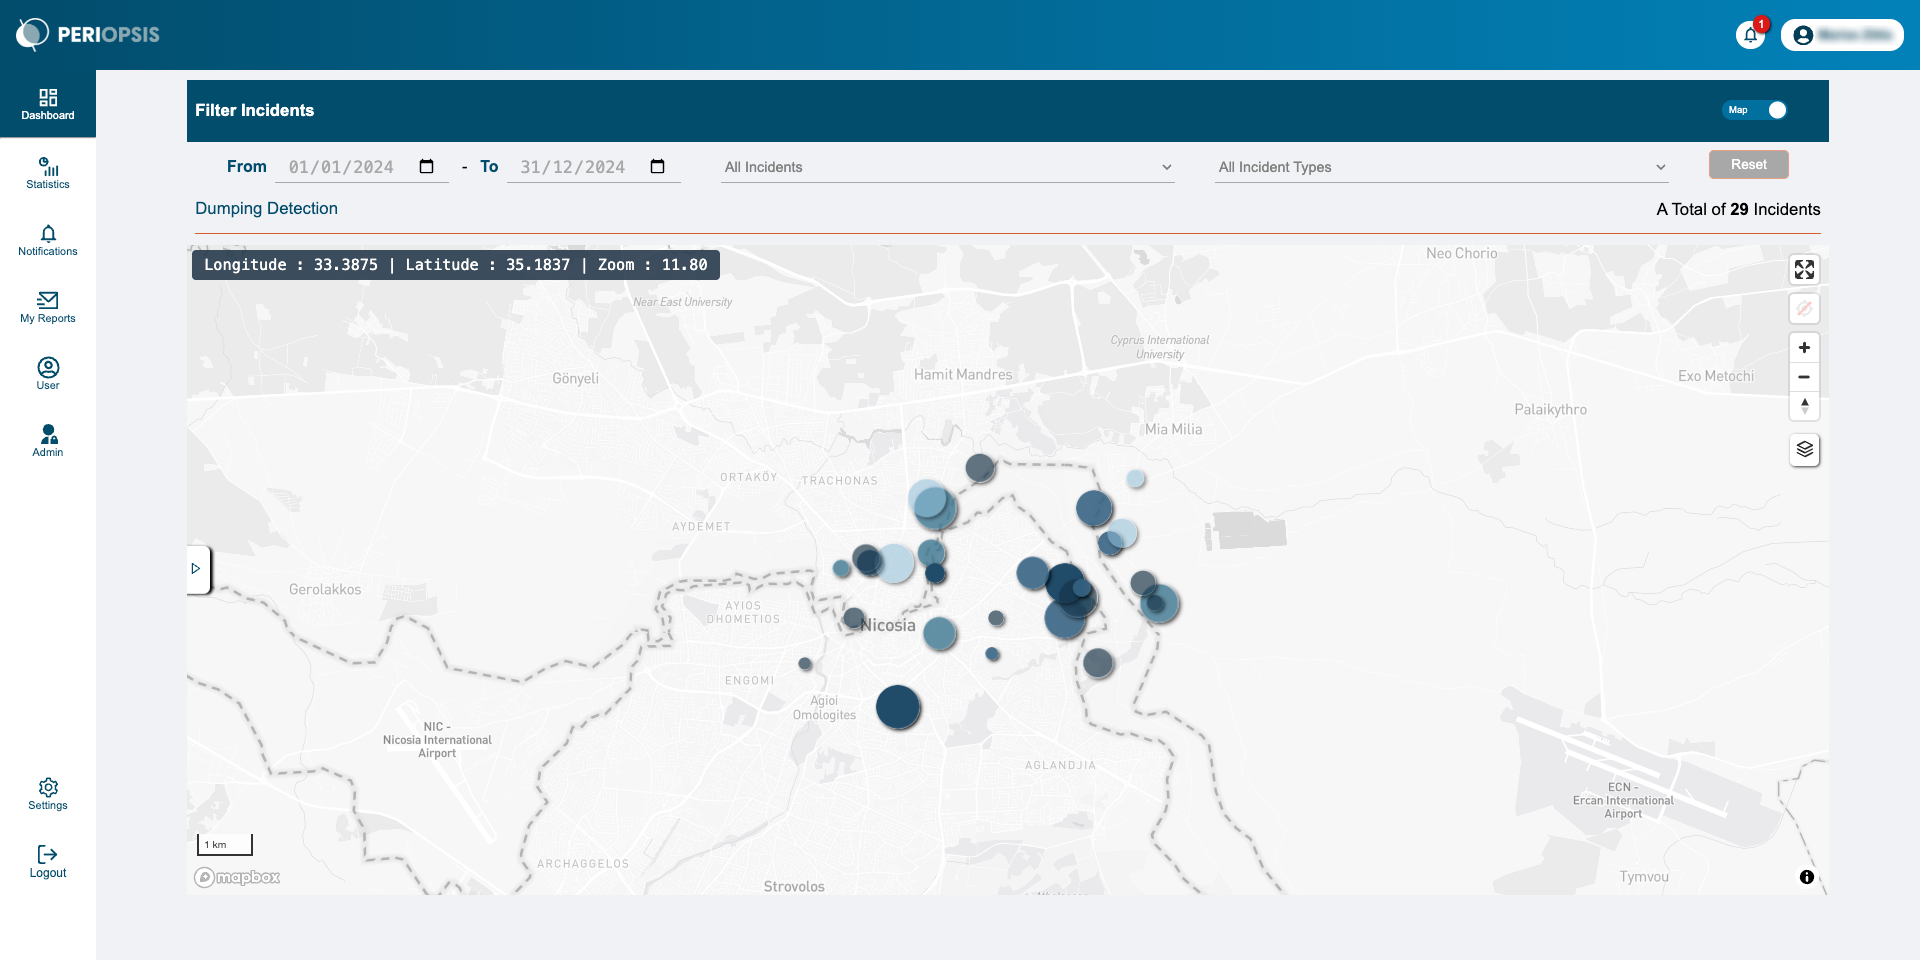
You can zoom in and out using the ‘+’ and ‘-‘ buttons on the map, or by using the scroll wheel on your mouse. To navigate the map, click and drag the map to move it around.

Statistics
The portal features a comprehensive ‘Statistics’ section that offers a wide range of insights related to the detected points of interest for each service (at this stage, Statistics work mainly for the “Dumping detection” service). The following statistics are available:
- Recent Statistics: Presents data from the latest 12 weeks.
- Statistics by Year: Presents charts showing weekly statistics per service/category within service (wherever relevant) within the span of a selected year. You can choose the year you want to view from the dropdown menu at the top of the tab.
- Heatmap: Presents detected points in the form of an incidents’ heatmap. The map displays areas with high detection frequency in a gradient of colors, allowing you to identify hotspots at a glance.
- Annual Actions: The ‘Annual Actions’ tab provides visual insights into actions taken during the current year.
Hint: Use the zoom and navigation features to explore different areas of the Heatmap.
Notifications
Click on the ‘Notifications’ button to stay up-to-date with the latest incidents detected by the service. You can also mark notifications as read or unread or archive any notifications you don’t need.
My reports
On the ‘My Reports’ page, you can view all active reports linked to your account. You can then view the incident of the active reports and take further actions from there, see the location of reported incidents on the map or you can archive any report that is not relevant anymore.
User
Your user profile contains your personal information and preferences. Here, you can view and update your profile information, such as your name, username and password. A confirmation email will be sent to your inbox every time you update this information.
Settings
The Settings section allows you to customize your experience at the PERIOPSIS Portal. You can visit this section to manage various options such as notification preferences, account security settings, preferred language, and dashboard display preferences.
For any additional questions, visit our Frequently Asked Questions (FAQs) where we provide quick answers to common questions about the PERIOPSIS Portal. The FAQs cover a range of topics, including account setup, dashboard navigation, subscription pricing, and data security.
Contact Support: If you need direct assistance or can’t find the answers to your questions in our FAQs, you can reach our support team by email. All users have access to our email support. Send your queries to [email protected] and our team will get back to you within 24 hours.